
AI Agents for Beginners - 10. AI Agents in Production: Observability & Evaluation
How to move AI agents from prototype to production — observability with traces and spans, key metrics, OpenTelemetry instrumentation, offline/online evaluation, cost management, and a real expense claim demo.
June 9, 2026
AI Agents for Beginners - 10. AI Agents in Production: Observability & Evaluation
This article summarizes Lesson 10 of Microsoft's AI Agents for Beginners course.
As AI agents transition from experimental prototypes to real-world applications, the ability to understand their behavior, monitor their performance, and systematically evaluate their outputs becomes critical.
The goal of this lesson is to provide the knowledge needed to transform a "black-box" agent into a transparent, manageable, and trustworthy system.
Traces and Spans
Traces and Spans are the core concepts for observing agent execution.
Observability tools such as Langfuse and Microsoft Foundry represent agent execution using this structure:
Observability tools such as Langfuse and Microsoft Foundry represent agent execution using this structure:
| Concept | Description |
|---|---|
| Trace | The entire agent task from start to finish (e.g., end-to-end processing of a user query) |
| Span | An individual step within a trace (e.g., an LLM call, data retrieval, tool execution) |
Trace & Span HierarchyMermaidflowchart TD
    T["Trace\nEntire Agent Task\n(User Query Processing)"]
    T --> S1["Span: LLM Call\nModel Inference"]
    T --> S2["Span: Tool Call\nget_flight_info()"]
    T --> S3["Span: Tool Call\nget_activity_suggestions()"]
    T --> S4["Span: LLM Call\nFinal Response Generation"]
    S1 -->|"latency, tokens"| M1["Metrics"]
    S2 -->|"latency, result"| M2["Metrics"]
    S3 -->|"latency, result"| M3["Metrics"]
    S4 -->|"latency, tokens"| M4["Metrics"]
Without observability, an AI agent feels like a "black box" where internal state and reasoning remain opaque.
With observability in place, the agent turns into a glass box, making it possible to build trust and verify that it is operating as intended.
With observability in place, the agent turns into a glass box, making it possible to build trust and verify that it is operating as intended.
Why Observability Matters in Production Environments
In production environments, observability is not a "nice-to-have" — it is a necessity:
| Reason | Description |
|---|---|
| Debugging & Root-Cause Analysis | Pinpoint error root causes across complex multi-LLM calls, tool interactions, and conditional logic using traces |
| Latency & Cost Management | Precisely track latency and cost per API call to identify and optimize slow or expensive operations |
| Trust, Safety & Compliance | Provide audit trails for agent actions and decisions — detecting prompt injection, harmful content, and PII mishandling |
| Continuous Improvement Loops | Establish feedback loops where production insights directly inform and improve offline experiments |
Key Metrics to Track
Key metrics to track to monitor agent behavior:
| Metric | Description | Example Usage |
|---|---|---|
| Latency | Agent response speed | Agent taking 20s → optimize with a faster model or parallel calls |
| Costs | Cost per agent execution | If 5 LLM calls yield marginal quality gains, reduce call count or use a cheaper model |
| Request Errors | Number of API errors and tool call failures | Configure fallback to provider B when LLM provider A is down |
| User Feedback | Explicit ratings (👍/👎, ⭐1-5) | Persistent negative feedback = signal that the agent is malfunctioning |
| Implicit User Feedback | Repeated questions, immediate rewrites, retry clicks | Asking the same question repeatedly = signal that the agent did not deliver the expected response |
| Accuracy | Frequency of correct and desirable outputs | Label traces with "succeeded"/"failed" → track success rates |
| Automated Evaluation Metrics | LLM-based automated scoring | RAGAS for RAG, LLM Guard for safety |
Instrument your Agent
The goal of agent instrumentation is to make your code emit traces and metrics so they can be captured, processed, and visualized on an observability platform.
OpenTelemetry
OpenTelemetry (OTel) is establishing itself as the industry standard for LLM observability.
Microsoft Agent Framework integrates natively with OpenTelemetry:
Microsoft Agent Framework integrates natively with OpenTelemetry:
otel_instrumentation.pypython
Manual Span Creation
While automatic instrumentation provides a baseline, you can manually create spans when more granular information is needed.
Add custom attributes such as
Add custom attributes such as
user_id, session_id, and model_version to spans for debugging and analytics:manual_span_langfuse.pypython
Building an Observable Agent
Implement simple observability by adding timing to a Travel Agent.
In production, integrate this with a tracing backend like OpenTelemetry:
In production, integrate this with a tracing backend like OpenTelemetry:
setup.pypython
travel_tools.pypython
observable_agent.pypython
Observable Agent FlowMermaidflowchart LR
    User["User Query\n'Plan a day trip in Paris'"]
    --> Timer["start_time = time.time()"]
    --> Agent["TravelAgent"]
    Agent --> F["get_flight_info('Paris')"]
    Agent --> A["get_activity_suggestions('Paris')"]
    F & A --> LLM["LLM\nSynthesize Response"]
    LLM --> Stop["elapsed = time.time() - start_time"]
    Stop --> Out["Response (elapsed s)\n+ Production: Send to OTel Backend"]
Agent Evaluation
Observability provides the metrics, while Evaluation is the process of analyzing that data to assess the agent's performance and determine how to improve it.
Because AI agents are non-deterministic and subject to change from updates and model drift, regular evaluation is essential.
Because AI agents are non-deterministic and subject to change from updates and model drift, regular evaluation is essential.
Evaluation falls into two categories: Offline Evaluation and Online Evaluation.
Offline Evaluation
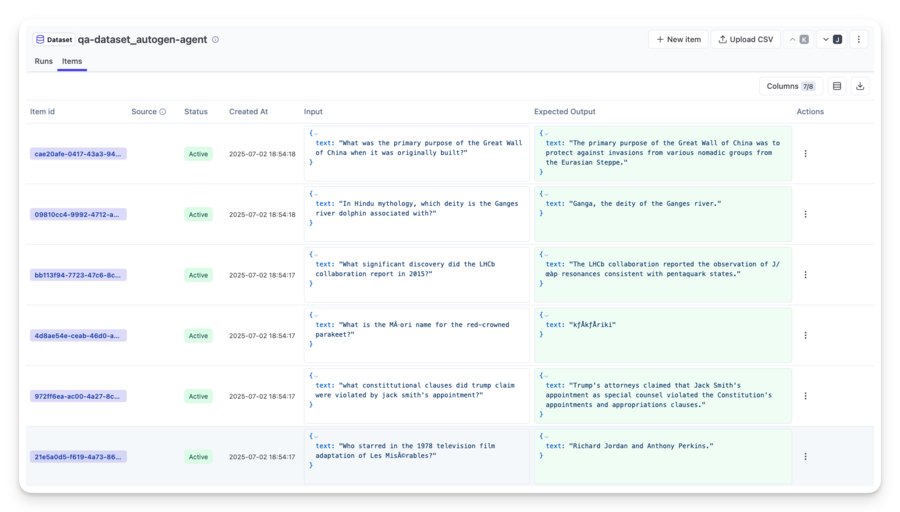
Evaluates the agent with a test dataset in a controlled environment.
Uses curated datasets with known expected outputs and runs during development (including CI/CD pipelines) to verify improvements or prevent regressions.
Uses curated datasets with known expected outputs and runs during development (including CI/CD pipelines) to verify improvements or prevent regressions.
- Advantages: Repeatable with ground truth, providing clear accuracy metrics
- Key Challenges: Keeping test datasets comprehensive and continuously updated with real-world scenarios
Online Evaluation
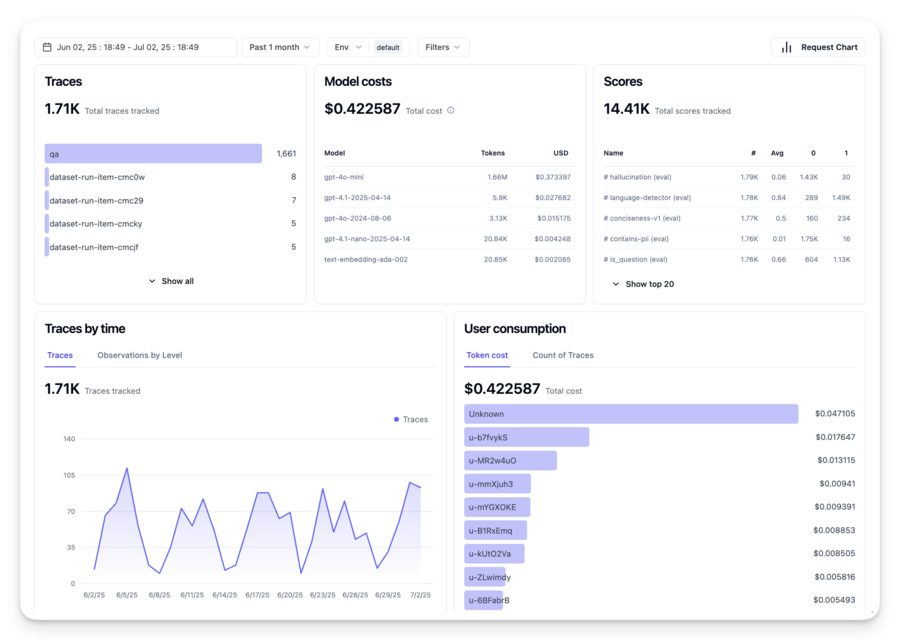
Evaluates the agent in a live, real-world environment.
Monitors performance during real user interactions and continuously analyzes outcomes.
Monitors performance during real user interactions and continuously analyzes outcomes.
- Advantages: Captures phenomena unforeseen in lab environments — model drift, unexpected query patterns
- Methods: Collecting implicit and explicit user feedback, shadow testing, A/B testing
Combining the two
Online and offline evaluations are not mutually exclusive — they are complementary:
Evaluation LoopMermaidflowchart LR
    OE["Offline Evaluation\nEvaluate with Test Dataset"]
    --> Deploy["Deploy\nDeploy to Production"]
    --> OL["Online Monitoring\nTrack Real User Interactions"]
    --> Collect["Collect Failures\nGather New Failure Cases"]
    --> Add["Enrich Offline Dataset\nAdd Edge Cases & New Patterns"]
    --> Refine["Refine Agent\nImprove Prompts, Models, Logic"]
    Refine --> OE
Evaluation Patterns
A common production pattern is leveraging a second agent as an evaluator.
The evaluator agent scores the primary agent's responses against set criteria:
The evaluator agent scores the primary agent's responses against set criteria:
evaluator_agent.pypython
Evaluator Agent PatternMermaidflowchart TD
    User["User Query"]
    --> Primary["Primary Agent\n(TravelAgent)"]
    Primary --> Resp["Agent Response"]
    Resp --> Eval["Evaluator Agent\n(ResponseEvaluator)"]
    Eval --> Score["Scores\nCompleteness · Accuracy · Helpfulness · Overall"]
    Score --> Gate{Meets Quality Criteria?}
    Gate -->|"Pass"| Deliver["Deliver to User"]
    Gate -->|"Fail"| Flag["Flag → Refine / Retry"]
Common Issues
Common issues and solutions when deploying AI agents to production:
| Issue | Solution |
|---|---|
| Inconsistent Task Execution | Refine prompts to clarify goals. Decompose tasks into subtasks and handle via multi-agent setups |
| Infinite Loops | Define explicit termination conditions. Use reasoning-specialized large models for complex reasoning and planning tasks |
| Degraded Tool Call Performance | Test and validate tool outputs outside the agent system. Refine parameters, prompts, and tool naming |
| Multi-Agent Misalignment | Keep each agent prompt clear and specific. Build hierarchical structures with "routing" or controller agents |
With observability in place, these issues can be identified far more effectively. Traces and metrics help pinpoint the exact location of problems within the agent workflow.
Managing Costs
Cost management strategies for production AI agents:
| Strategy | Description |
|---|---|
| Using Smaller Models | SLMs perform well in specific agentic use cases and significantly reduce costs. Use SLMs for simple tasks (intent classification, parameter extraction) and large models only for complex reasoning |
| Using a Router Model | Route requests to the optimal model based on complexity using an LLM/SLM or serverless function. Simple queries → small, fast models; complex reasoning → large models |
| Caching Responses | Cache common requests and tasks to serve responses before similar requests hit the agent system. Drastically reduces costs for FAQs and standard workflows |
Cost Management: Router Model StrategyMermaidflowchart TD
    Req["User Request"]
    --> Router["Router Model\n(LLM/SLM/serverless)"]
    Router --> Complexity{Classify Complexity}
    Complexity -->|"Simple\nIntent Classification & Parameter Extraction"| SLM["SLM\n(GPT-4o-mini, etc.)\nLow Cost · High Speed"]
    Complexity -->|"Complex\nComplex Reasoning & Planning"| LLM["Large Model\n(GPT-4o, etc.)\nHigh Performance"]
    Complexity -->|"Cached\nFrequently Asked Questions"| Cache["Cache\nInstant Response\nZero Cost"]
    SLM & LLM & Cache --> Response["Final Response"]
Lets see how this works in practice
As a hands-on example, we implement a receipt image OCR → expense claim email generation pipeline.
We connect an OCR Agent and an Email Agent using the multi-agent
We connect an OCR Agent and an Email Agent using the multi-agent
WorkflowBuilder.Define Expense Models
expense_models.pypython
Defining Tools
expense_tools.pypython
Processing Expenses
expense_workflow.pypython
Expense Claim WorkflowMermaidflowchart LR
    Receipt["receipt.jpg\nReceipt Image"]
    --> OCR["OCRAgent\nload_receipt_image()\nImage → base64 Encoding"]
    OCR --> Parse["Parse Receipt Text\ndate|description|amount|category\nSemicolon-Separated Format"]
    Parse --> Email["EmailAgent\ngenerate_expense_email()\nExpenseFormatter.parse_expenses()"]
    Email --> Mail["Expense Claim Email\nDear Finance Team...\nTotal Amount: $xxx"]
Summary
Lesson 10 SummaryMermaidflowchart LR
    Root["AI Agents\nin Production"]
    Root --> Obs["Observability"]
    Root --> Eval["Evaluation"]
    Root --> Cost["Cost Management"]
    Obs --> O1["Traces & Spans"]
    Obs --> O2["Key Metrics\nLatency·Cost·Error·Feedback"]
    Obs --> O3["OpenTelemetry\n+ Manual Spans"]
    Eval --> E1["Offline Evaluation\nControlled Test Datasets"]
    Eval --> E2["Online Evaluation\nReal User Monitoring"]
    Eval --> E3["Evaluator Agent\nAutomated Quality Scoring"]
    Cost --> C1["Smaller Models (SLMs)"]
    Cost --> C2["Router Model"]
    Cost --> C3["Caching"]
- Turn agents from "black boxes" into "glass boxes" using Traces & Spans, enabling effective debugging and optimization.
- Track key metrics such as latency, cost, request errors, and user feedback to gain a comprehensive view of agent health.
- Establish pre-deployment baselines with Offline Evaluation, and capture real-world drift and unexpected patterns with Online Evaluation.
- Prevent regressions with the Evaluator Agent pattern by applying automated quality gating to primary agent responses.
- Manage costs using router models, SLMs, and caching while reserving high-performance models for tasks that require them.